Learn how to zoom into and out of Column, Horizontal, and Line Charts in Data Lab.
Overview
Column, Horizontal, and Line Charts can be filled with data that can be hard to see. You can use the View toolbar to see your data details better.
Zoom into and out of Column, Horizontal, and Line Charts
Select the Zoom icon to improve the view and see more chart details.
Rotate the wheel button on your mouse or select and highlight where you want to zoom in.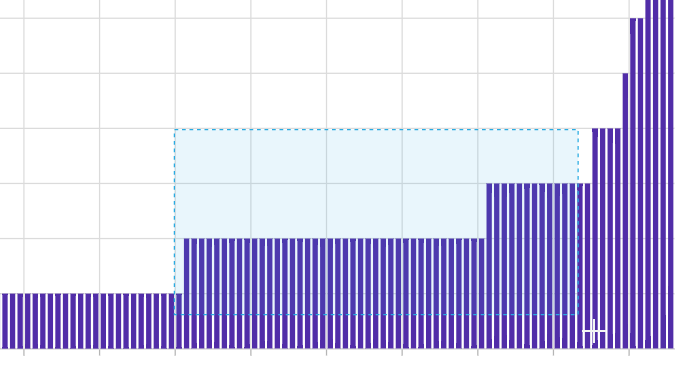
To zoom out, select the Zoom out icon.
You can also rotate the wheel button on your mouse to zoom out.
To pan and drag the chart around, select the Pan icon.
To reset the view, select the Reset icon.